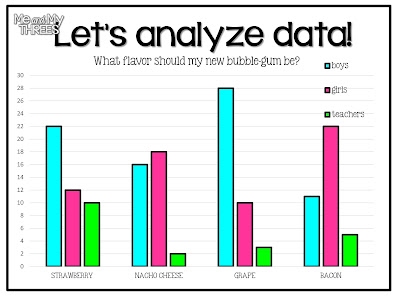
Students will be required to provide information they interpret from the graph and then answer the following discussion questions:
- How many teachers chose bacon-flavored gum?
- What is the scale of this graph?
- How can you determine how many people were interviewed?
- How many more boys votes did Nacho-Cheese need to be tied with Strawberry?


No comments:
Post a Comment