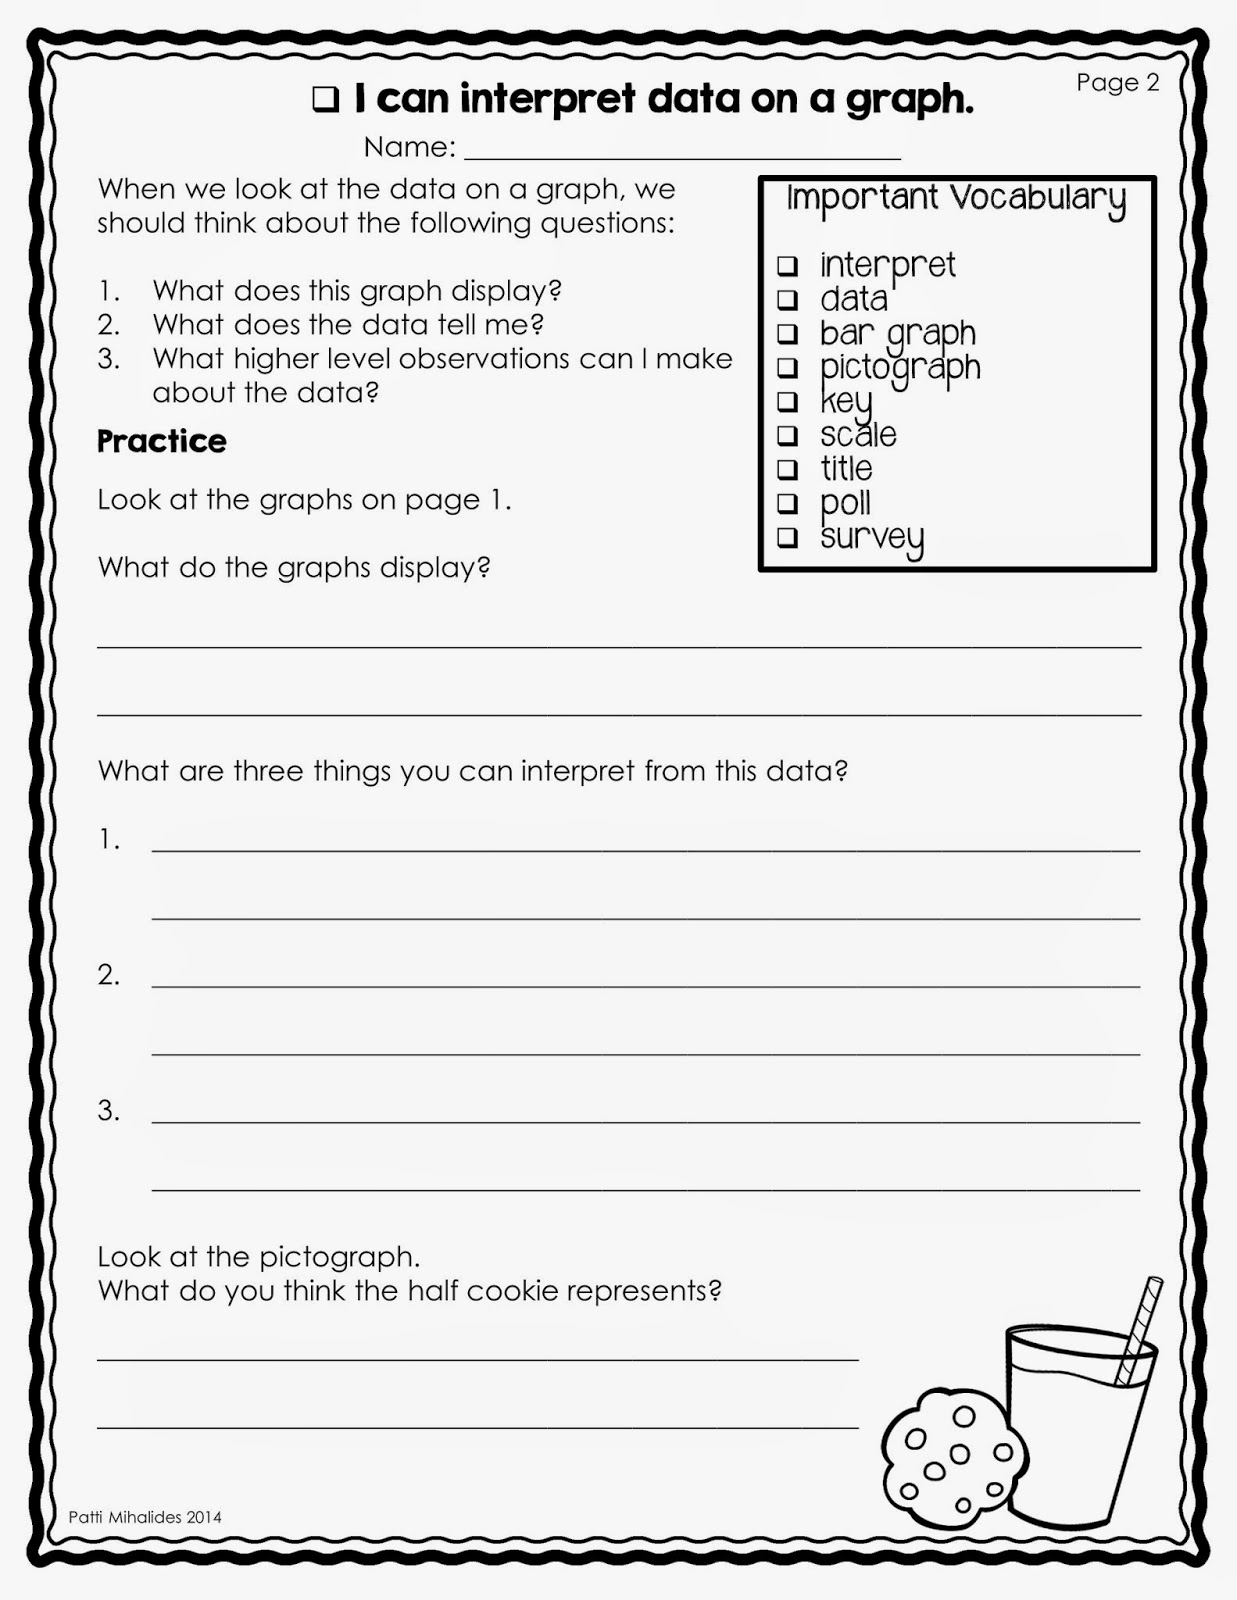
It'll take us about two weeks or so, but we're moving on from 2 and 3-digit addition and subtraction. Students will still have opportunities to practice those skills, only this time, they'll be applying them to word problems that relate to interpreting data.
Today's lesson was a look at how we interpret data (we even used that word: interpret)
We'll also explore the difference between what we can interpret from data and what we observe or notice on a graph. So we might observe that the graph is a bar graph and the bars are yellow, but when we interpret data, we have to do a little bit of math. For example, in the bar graph below, one can interpret that 9 chocolate chip cookies were left over after the bake sale.
I've attached a document taken directly from the teacher support materials for the old Math Makes Sense program that outlines some of the learning goals and big ideas for this unit. We no longer rely exclusively on this resource, but I still like the way they break down each unit into Big Ideas and Learning Goals.
Unit 5 Big Ideas and Learning Goals
Here is an older video tutorial for the boys and girls on the difference between interpreting and observing/noticing.


